


【ELK】安装教程
前言
在复杂的企业应用服务群中,记录日志方式多种多样,并且不易归档以及提供日志监控的机制。无论是开发人员还是运维人员都无法准确的定位服务、服务器上面出现的种种问题,也没有高效搜索日志内容从而快速定位问题的方式。因此需要一个集中式、独立的、搜集管理各个服务和服务器上的日志信息,集中管理,并提供良好的UI界面进行数据展示,处理分析。
得此:ELK提供一套开源的解决方案,能高效、简便的满足以上场景。
ELK分别是Elasticsearch、Logstash、Kibana三个开源框架缩写。
| 框架 | 简介 |
|---|---|
| Elasticsearch | 开源分布式搜索引擎,提供存储、分析、搜索功能。特点:分布式、基于reasful风格、支持海量高并发的准实时搜索场景、稳定、可靠、快速、使用方便等。 |
| Logstash | 开源日志搜集、分析、过滤框架,支持多种数据输入输出方式。 |
| Kibana | 开源日志报表系统,对elasticsearch以及logstash有良好的web页面支持。 |
1. ELK下载
Elasticsearch : 接收搜集的海量结构化日志数据,并提供给Kibana查询分析。
Logstash : 对日志进行过滤形成结构化数据,并转发到Elasticsearch中。
Kibana : 对Elasticsearch提供的数据进行分析展示。
组件下载:
https://www.elastic.co/cn/downloads/elasticsearch
https://www.elastic.co/cn/downloads/kibana
https://www.elastic.co/cn/downloads/logstash
本文档用的目前最新的版本8.12.2:
elasticsearch-8.12.2-linux-x86_64.tar.gz
logstash-8.12.2-linux-x86_64.tar.gz
kibana-8.12.2-linux-x86_64.tar.gz
2.上传到服务器并解压
tar -xvzf elasticsearch-8.12.2-linux-x86_64.tar.gz
tar -xvzf kibana-8.12.2-linux-x86_64.tar.gz
tar -xvzf logstash-8.12.2-linux-x86_64.tar.gz
3. 安装elasticsearch
3.1 初始化启动
在正式安装前可以启动一下,es会自动生成一些文件和配置,方便安装
首次启动 Elasticsearch 时,会自动进行以下安全配置:
- 为传输层和 HTTP 层生成 TLS 证书和密钥。
- TLS 配置设置被写入elasticsearch.yml
- 为 elastic 用户生成密码。
- 为 Kibana 生成一个注册令牌。
cd /home/ziggszhao/app/elasticsearch/bin
./elasticsearch
8.x的版本启动后会有以下信息输出:
✅ Elasticsearch security features have been automatically configured!
✅ Authentication is enabled and cluster connections are encrypted.

ℹ️  Password for the elastic user (reset with `bin/elasticsearch-reset-password -u elastic`):
  kL0rJcC7YP-xVf45txCr

ℹ️  HTTP CA certificate SHA-256 fingerprint:
  8a093557db76fcea2d52f54fe9a86095d17b5f3a336a5168ed7b086fc35cb1af

ℹ️  Configure Kibana to use this cluster:
• Run Kibana and click the configuration link in the terminal when Kibana starts.
• Copy the following enrollment token and paste it into Kibana in your browser (valid for the next 30 minutes):
  eyJ2ZXIiOiI4LjEyLjIiLCJhZHIiOlsiMTkyLjE2OC4zMS4xMTE6OTIwMCJdLCJmZ3IiOiI4YTA5MzU1N2RiNzZmY2VhMmQ1MmY1NGZlOWE4NjA5NWQxN2I1ZjNhMzM2YTUxNjhlZDdiMDg2ZmMzNWNiMWFmIiwia2V5Ijoiakpaa0hJNEJEdHhoelVzOUZXQlI6ZHAyUTM0R0ZTbk8yN1RwanZKOHBsdyJ9

ℹ️  Configure other nodes to join this cluster:
• On this node:
  ⁃ Create an enrollment token with `bin/elasticsearch-create-enrollment-token -s node`.
  ⁃ Uncomment the transport.host setting at the end of config/elasticsearch.yml.
  ⁃ Restart Elasticsearch.
• On other nodes:
  ⁃ Start Elasticsearch with `bin/elasticsearch --enrollment-token <token>`, using the enrollment token that you generated.
3.2 修改默认密码
因为启动生成的默认密码不方便记忆,所以进行修改
在es服务启动的情况下,修改密码
cd /home/ziggszhao/app/elasticsearch/bin
修改elastic的密码,用于登录elastic
./bin/elasticsearch-reset-password -u elastic -i
修改elastic的密码,用于登录kibana
./bin/elasticsearch-reset-password -u kibana -i
3.3 验证服务
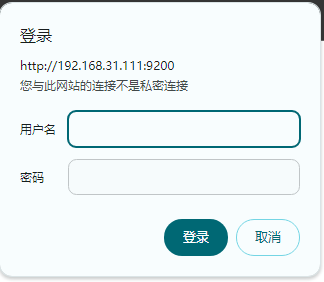
8.x默认开启了ssl,后面配置会关掉,这里使用https访问
https://ip:9200/
输入账号密码,登录成功即可
验证后,杀掉第一次启动的es进程,进行接下来的配置安装
3.4 修改es配置文件
cd /home/ziggszhao/app/elasticsearch/config
vim elasticsearch.yml
修改后的配置如下:
#集群名字,目前是单节点
cluster.name: elk
#节点名
node.name: node-1
path.data: /home/es/elasticsearch-8.8.2/data
path.logs: /home/es/elasticsearch-8.8.2/logs
#不锁定jvm内存
bootstrap.memory_lock: false
#配置可进行数据交互的ip
network.host: 0.0.0.0
#允许http跨域访问,es_head插件必须开启
http.cors.enabled: true
http.cors.allow-origin: "*"

#es_head连接时读取用户名密码
http.cors.allow-headers: Authorization,X-Requested-With,Content-Length,Content-Type

# 开启安全认证 , 本机测试可以使用关闭了安全验证,生产建议开启
# 由于ES 8.x的安全模块启用后集群的搭建和kibana需要证书验证才可以,因此此处不建议开启
#	下面也会书写开启安全验证后配置
xpack.security.enabled: false
xpack.security.enrollment.enabled: true
xpack.security.http.ssl:
	#ssl默认开启,这里也关掉
  enabled: false
  keystore.path: certs/http.p12
xpack.security.transport.ssl:
  enabled: true
  verification_mode: certificate
  keystore.path: certs/transport.p12
  truststore.path: certs/transport.p12
#主节点
cluster.initial_master_nodes: ["node-1"]
http.host: 0.0.0.0
3.5 启动
./elasticsearch -d
启动时如果报下面的错误
[2024-03-08T13:00:06,515][ERROR][o.e.b.Elasticsearch      ] [ziggszhao-virtual-machine-241] node validation exception
[1] bootstrap checks failed. You must address the points described in the following [1] lines before starting Elasticsearch. For more information see [https://www.elastic.co/guide/en/elasticsearch/reference/8.12/bootstrap-checks.html]
bootstrap check failure [1] of [1]: max virtual memory areas vm.max_map_count [65530] is too low, increase to at least [262144]; for more information see [https://www.elastic.co/guide/en/elasticsearch/reference/8.12/_maximum_map_count_check.html]
原因:
vm.max_map_count 是一个 Linux 内核参数,用于设置进程的最大内存映射数量。在一些特定的应用场景中,例如运行 Elasticsearch,需要适当地调整 vm.max_map_count 的值。
解决方案:
如果你想永久修改 vm.max_map_count 的值,可以编辑 /etc/sysctl.conf 文件,在文件的末尾添加一行:
vm.max_map_count=262144
然后加载配置
sudo sysctl -p
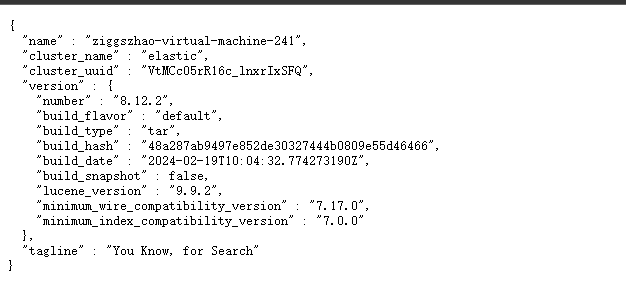
3.6 验证
访问http://ip:9200
开启了ssl访问:https://ip:9200
4. 安装kibana
Kibana依赖es,安装Kibana请确保es服务没问题
由于我们未启用security ,kibana启动非常简单, 简单配置如下:
server.port: 5601
server.host: 0.0.0.0
# 连接es,账号密码在安装es的时候配置过了
elasticsearch.hosts: ["http://127.0.0.1:9200"]
elasticsearch.username: "kibana"
elasticsearch.password: "123456"
elasticsearch.ssl.certificateAuthorities:["/home/ziggszhao/app/elasticsearch/config/certs/http_ca.crt"]
# 设置成中文
i18n.locale: "zh-CN"
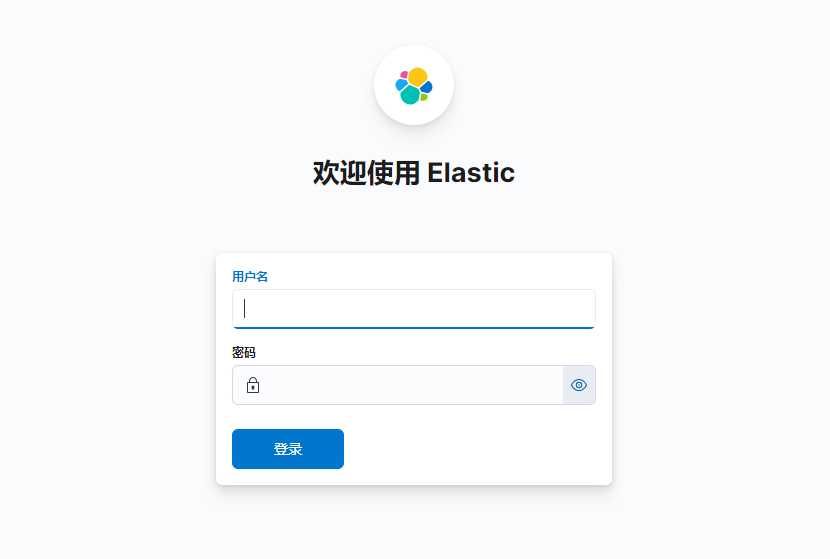
输入elastic的账户密码即可
5. 安装logstash
5.1 配置
要先在logstash的config目录下,新建一个logback-elk.conf配置文件,应该我暂时用logback传输日志到logstash,所以就建了个logback-elk.conf的配置文件,命名随意。(暂时还没玩透kafka,所以当前先不用kafka传输日志)
logback-elk.conf配置的内容如下:
input {
    tcp {
        port => 4560  #logstash服务开启的端口号
        mode => "server"
        tags => ['tags']
        codec => json_lines    #解析方式为json格式打印
    }
}
output {
        elasticsearch {
                hosts => ["elasticsearch服务器地址:9200"]  #elasticsearch 主节点
                index =>"%{[appname]}-%{+YYYY.MM.dd}"  #appname 为在springboot项目中配置logback时用到,指向项目名
		        user => "elastic" # 注意:这里演示使用超级账号,安全起见最好是使用自定义的账号,并授予该用户创建索引的权限,具体看下方地址
                password => "对应账户密码"
                cacert => "/home/ziggszhao/app/elasticsearch/config/certs/http_ca.crt"
    		    ca_trusted_fingerprint => "09189c0bb278418a22618b0e7c98b32f603d509272d591fb790043815b67d7ae"
        }
        stdout { codec => rubydebug}
}
5.2 修改logstash.yml
xpack.monitoring.enabled: true
xpack.monitoring.elasticsearch.username: "elastic"
xpack.monitoring.elasticsearch.password: "123456"
xpack.monitoring.elasticsearch.proxy: "http://127.0.0.1:9200"
xpack.monitoring.elasticsearch.ssl.certificate_authority: "/home/ziggszhao/app/elasticsearch/config/certs/http_ca.crt"
xpack.monitoring.elasticsearch.ssl.ca_trusted_fingerprint: 8a093557db76fcea2d52f54fe9a86095d17b5f3a336a5168ed7b086fc35cb1af
5.3 检查配置是否有错:
进入logstash安装目录的bin目录中,使用下面命令检查
./logstash -f ../config/logback-elk.conf --config.test_and_exit
命令说明:
–path.settings 用于指定logstash的配置文件所在的目录
-f 指定需要被检测的配置文件的路径
–config.test_and_exit 指定检测完之后就退出,不然就会直接启动了
出现下面的Configuration OK说明内容配置没什么问题
Configuration OK
[2024-03-09T02:51:34,084][INFO ][logstash.runner          ] Using config.test_and_exit mode. Config Validation Result: OK. Exiting Logstash
6. 开机启动脚本
在/etc/systemd/system目录新建以下文件
elasticsearch.service
[Unit]
# 服务名称,可自定义
Description = elasticsearch
After=network-online.target
Wants=network-online.target

[Service]
Type = simple
User = ziggszhao
ExecStart = /home/ziggszhao/app/elasticsearch/bin/elasticsearch

[Install]
WantedBy = multi-user.target
logstash.service
[Unit]
# 服务名称,可自定义
Description = logstash
After=network-online.target
Wants=network-online.target

[Service]
Type = simple
User = ziggszhao
ExecStart = /home/ziggszhao/app/logstash/bin/logstash -f /home/ziggszhao/app/logstash/config/logback-elk.conf

[Install]
WantedBy = multi-user.target
kibana.service
[Unit]
# 服务名称,可自定义
Description = kibana
After=network-online.target
Wants=network-online.target

[Service]
Type = simple
User = ziggszhao
ExecStart = /home/ziggszhao/app/kibana/bin/kibana

[Install]
WantedBy = multi-user.target
systemctl daemon-reload
systemctl enable 服务名
systemctl start 服务名